
AM Modulator
published
This is going to be a section of articles dedicated to the practical labs I am taking right now at Purdue. I want to take advantage and not just keep the labs in a PDF report but also here to share them with all of you.
Report 3: .
5.1. AM Modulator
5.1.1 Execute the flowgraph and listen to the resulting audio. Provide time and frequency domain display plots of the audio signal.
We heard an annoying stable sound.
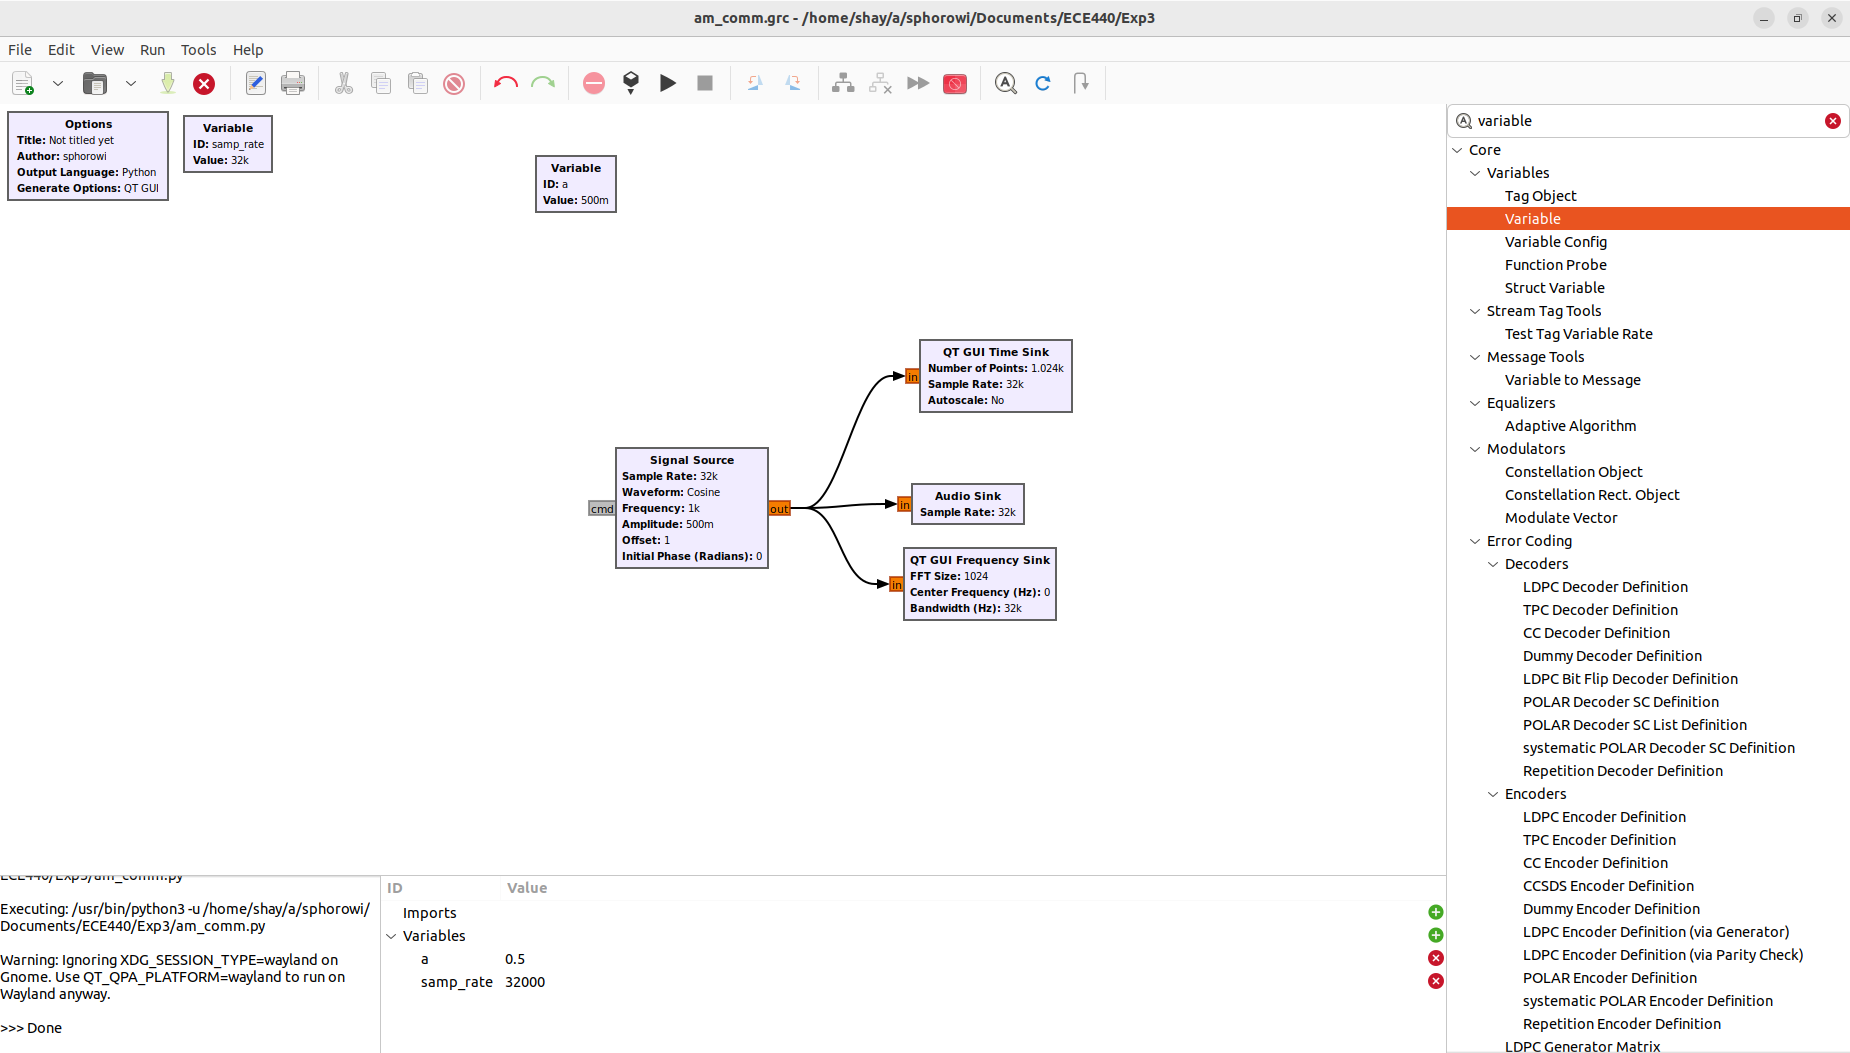
5.1.2. Provide a screenshot of your flowgraph.
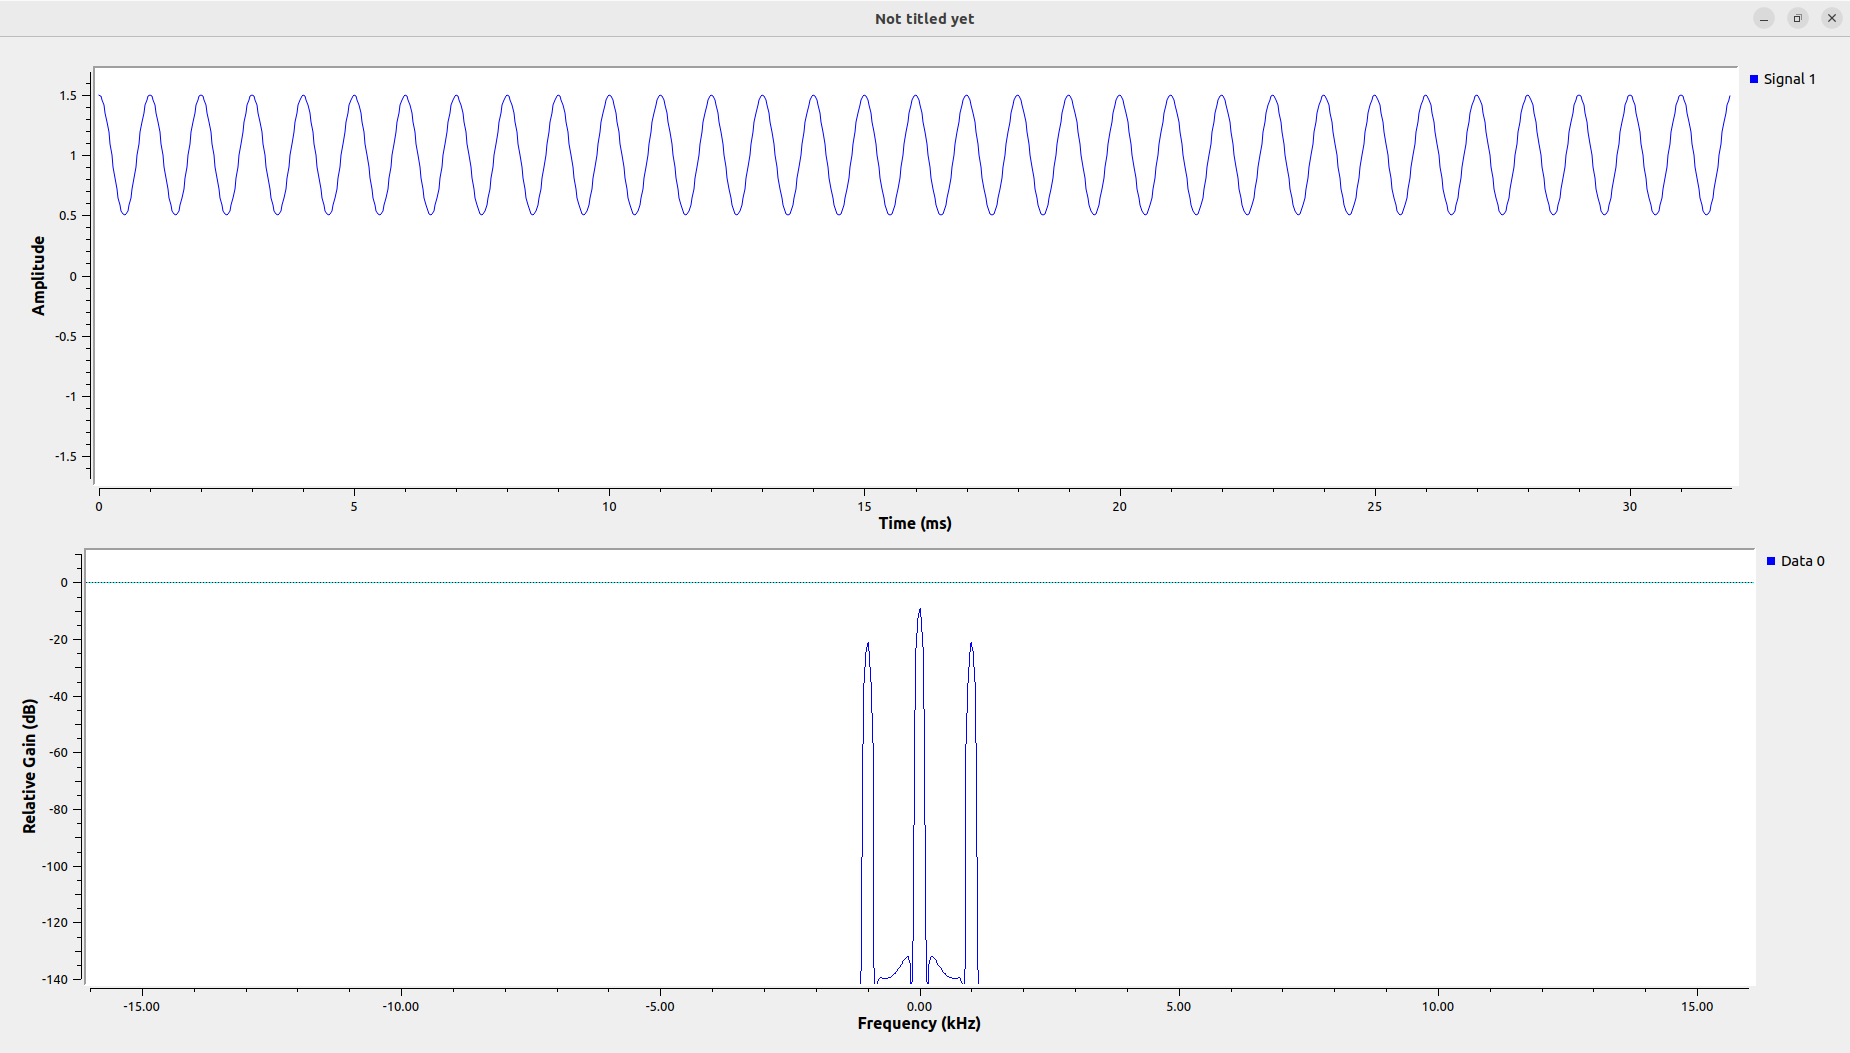
5.1.3. Execute the flowgraph, and provide time domain display plots of the input signal for a=0,
a=0.5, and a=1.0. (Note: make sure your flowgraph sample rate is set appropriately to avoid
aliasing issues)
At a = 0. We see that the effect of the envelop on the amplitude is a smooth an small.
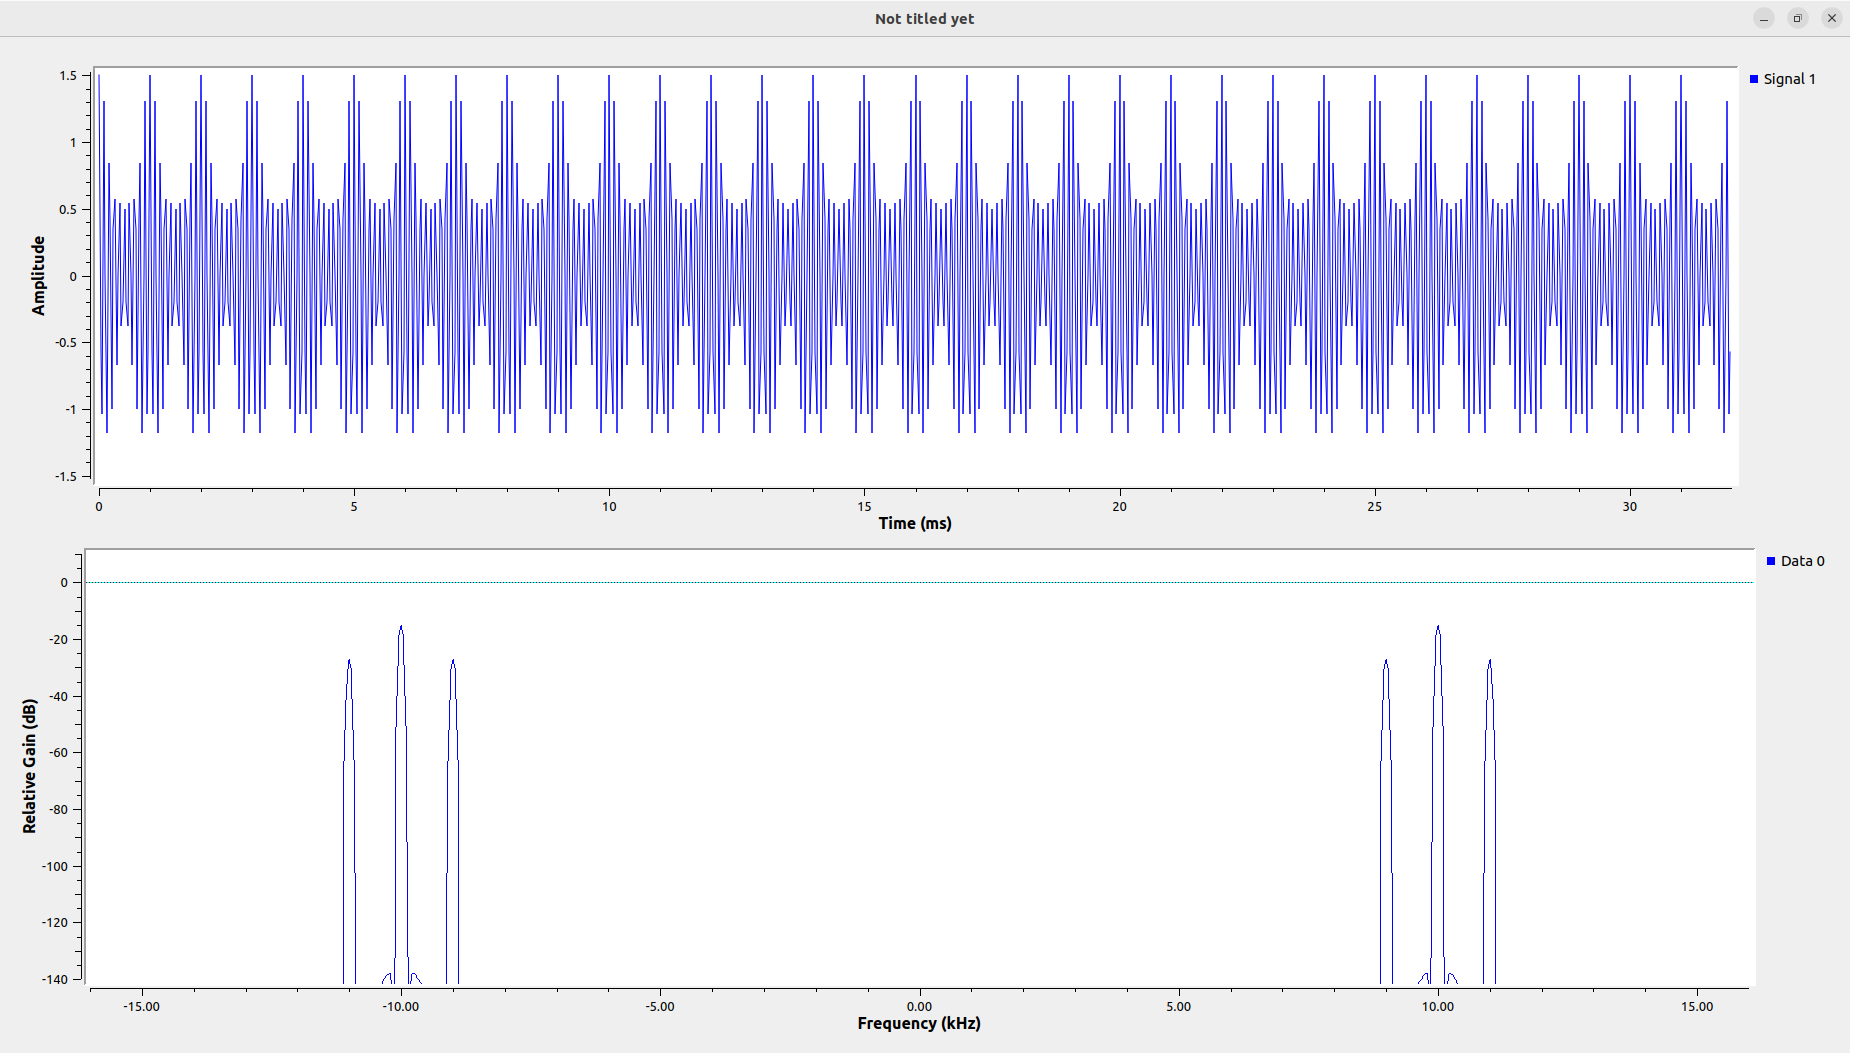
At a = 0.5 the envelope is more pronounced and has a greater weight in our signal, it varies more from our message signal. Variatianing 0.5 of the amplitude of our carrier signal.
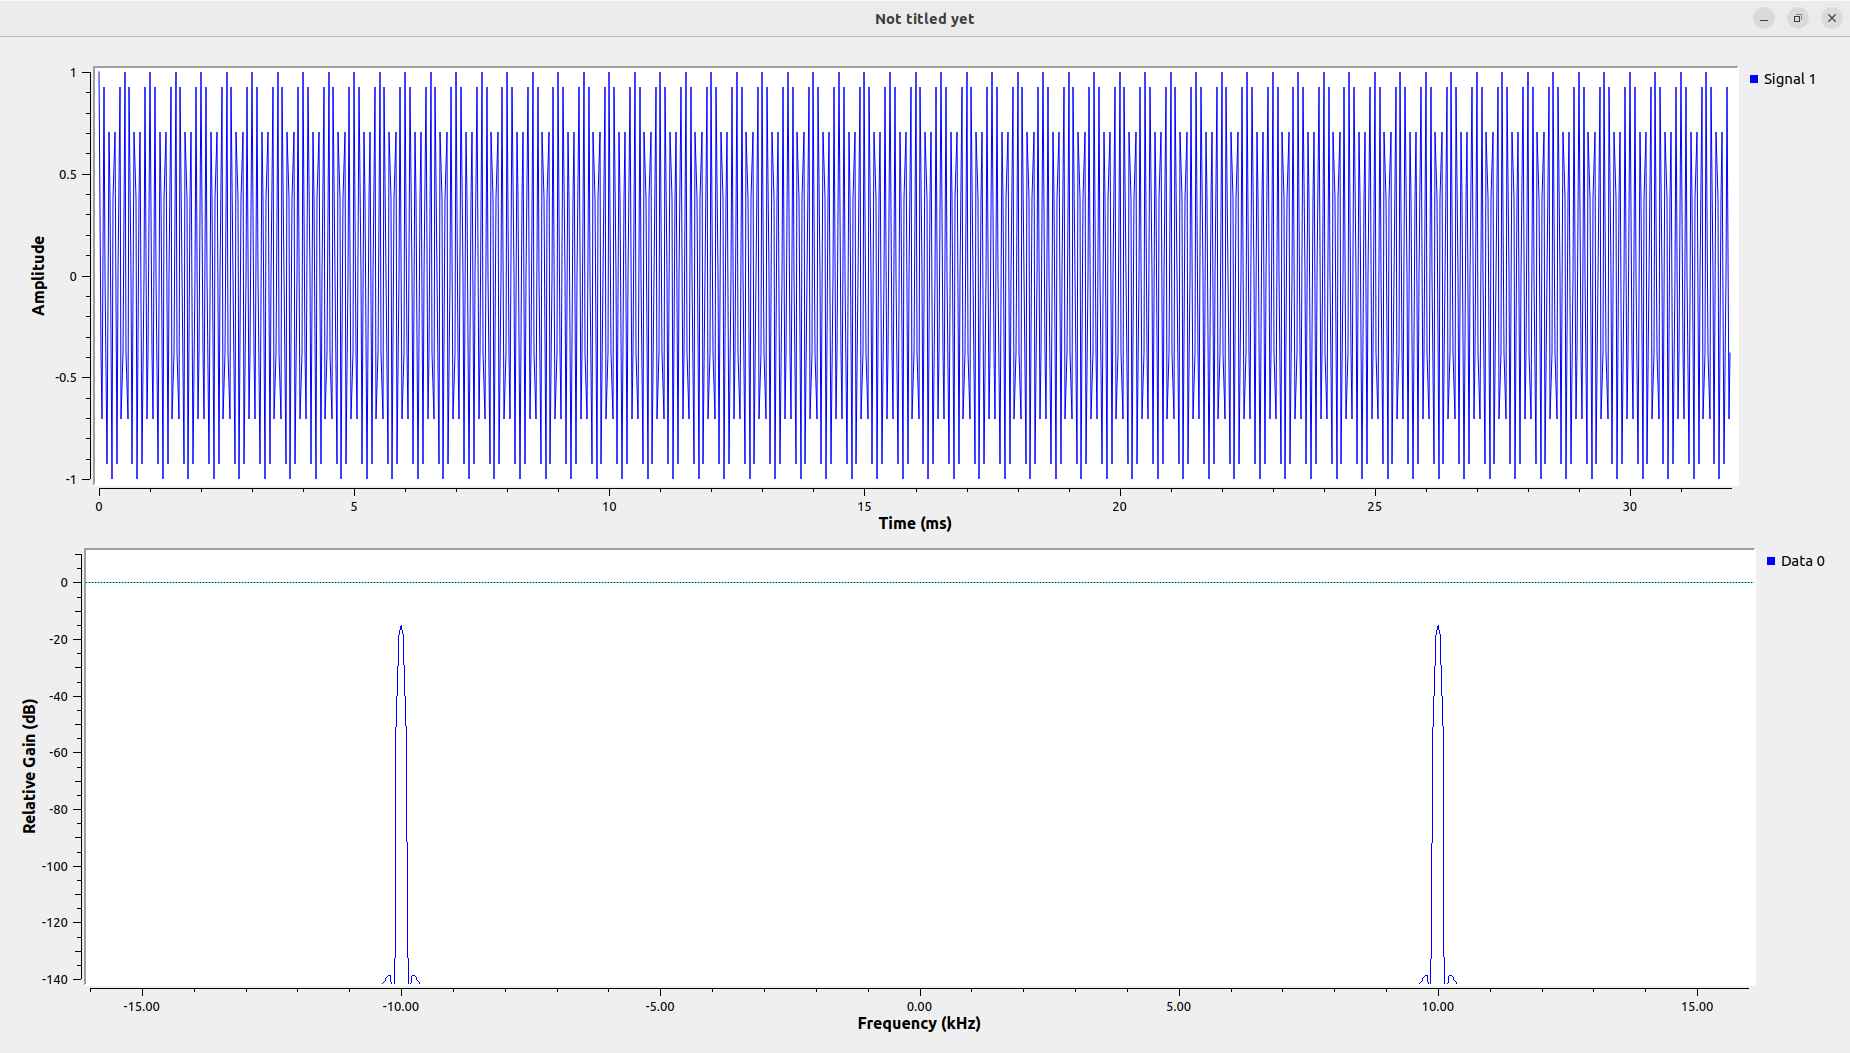
In the case of a = 1 the variation of the envelop in the amplitud domain is the same as the carrier signal. It creates a spiky signal in which the message signal is very notable.
5.1.4. What effect does the modulation index have on the modulated signal?
Higher modulation index creates more apparent envelope around the modulated signal
5.2. AM Demodulator
5.2.1. Provide a screenshot of your flowgraph with the AM demodulator included.
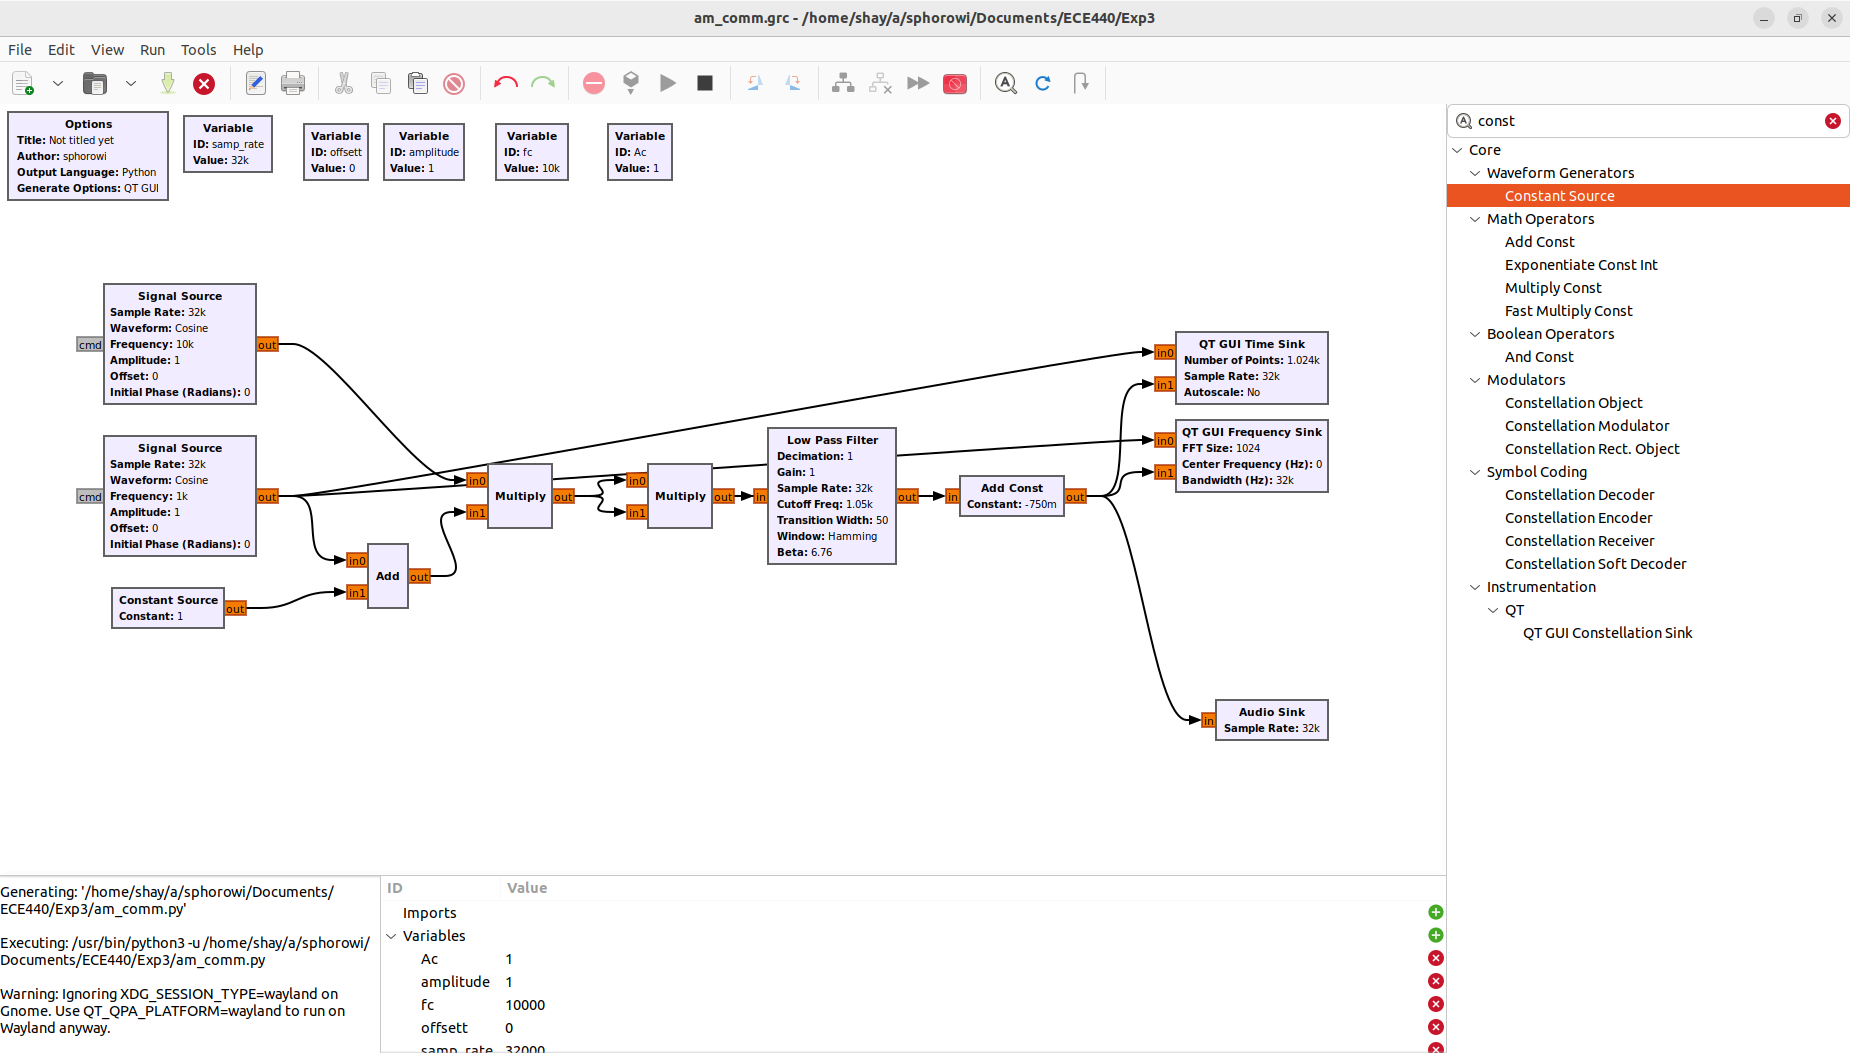
Here, we are taking our AM modulated signal and we are squaring it and passing it through a LPF to delete not wanted frequencies. Moreover, we add a constant variable to eliminate the DC value added at modulation.
5.2.2. What cutoff frequency and transition width settings for the low pass filter were found to be most useful for accurately demodulating the AM waveform?
A good cutoff frequency was 1.05Hz since we wanted to filter our original signal at |f| < 1kHz.
For the transition width 50 worked satisfactorily.
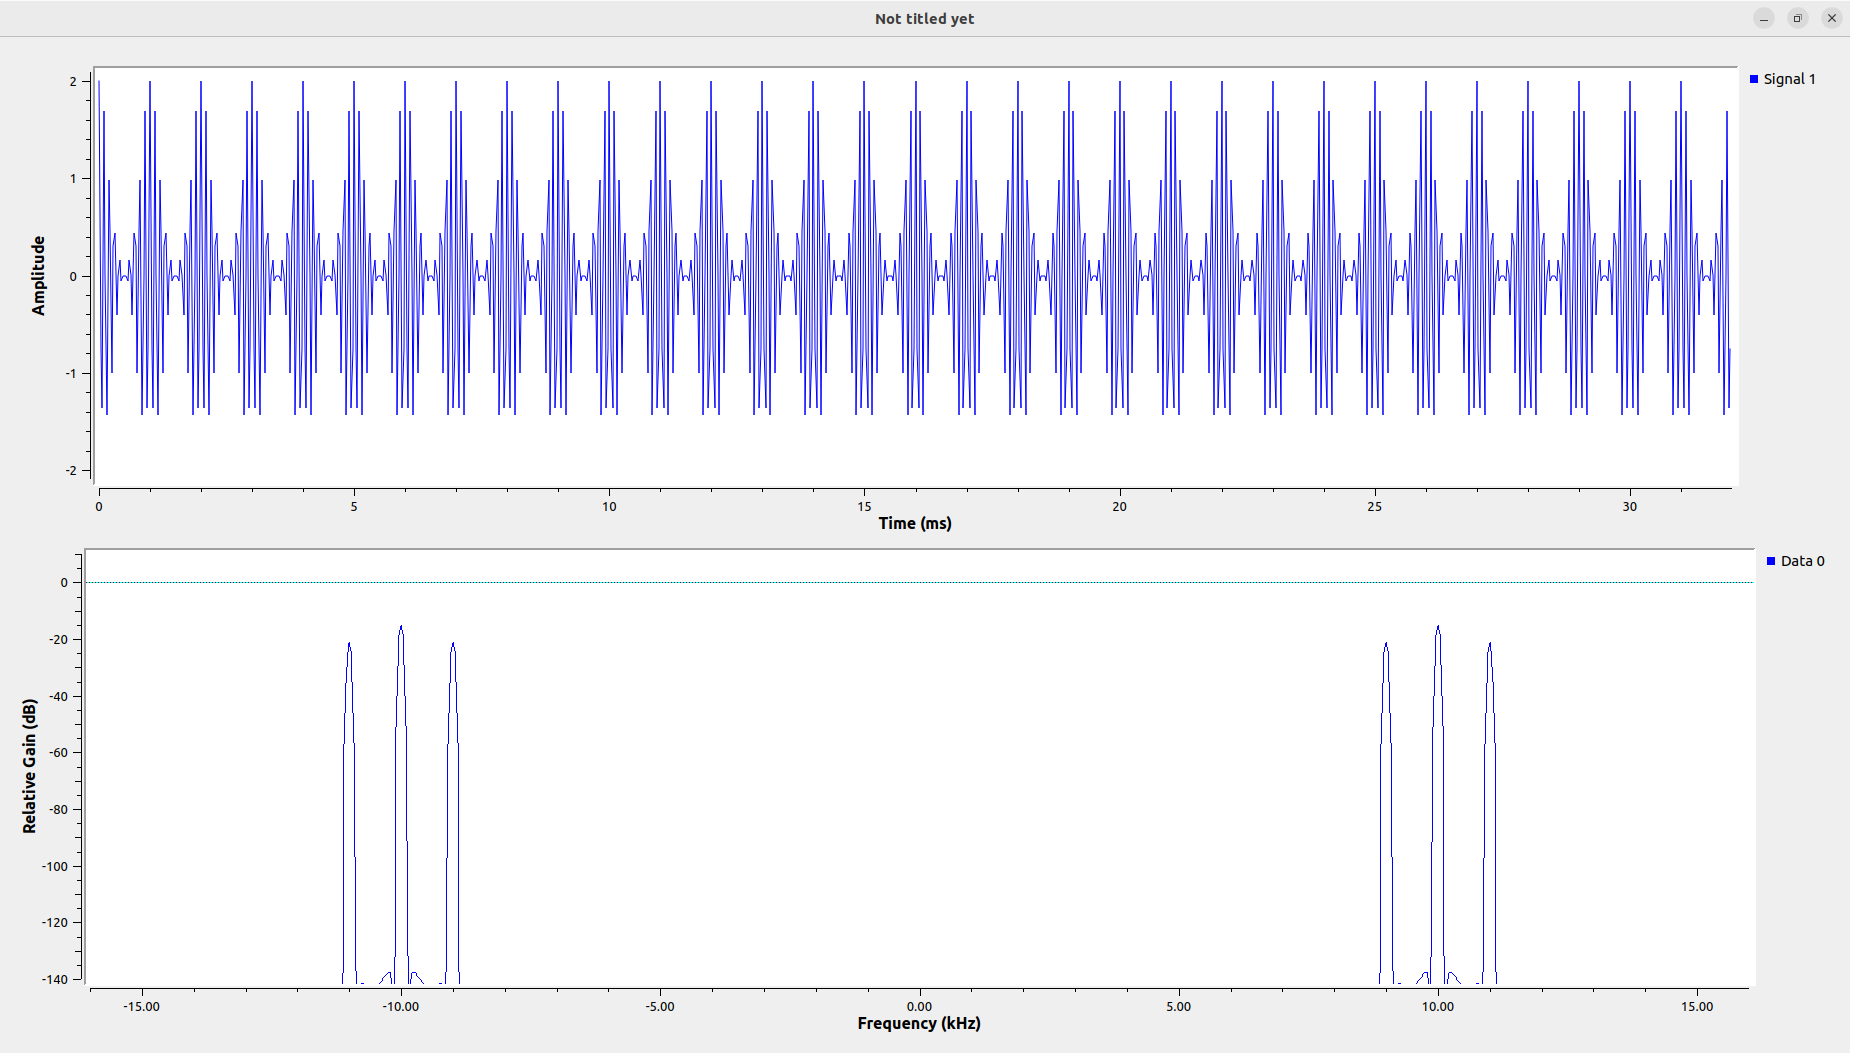
5.2.3. Include time and frequency domain display plots depicting the original and received AM waveforms.
We can check that our demodulation process works properly (not perfectly, we can see a phase shift, maybe due to the LPF).
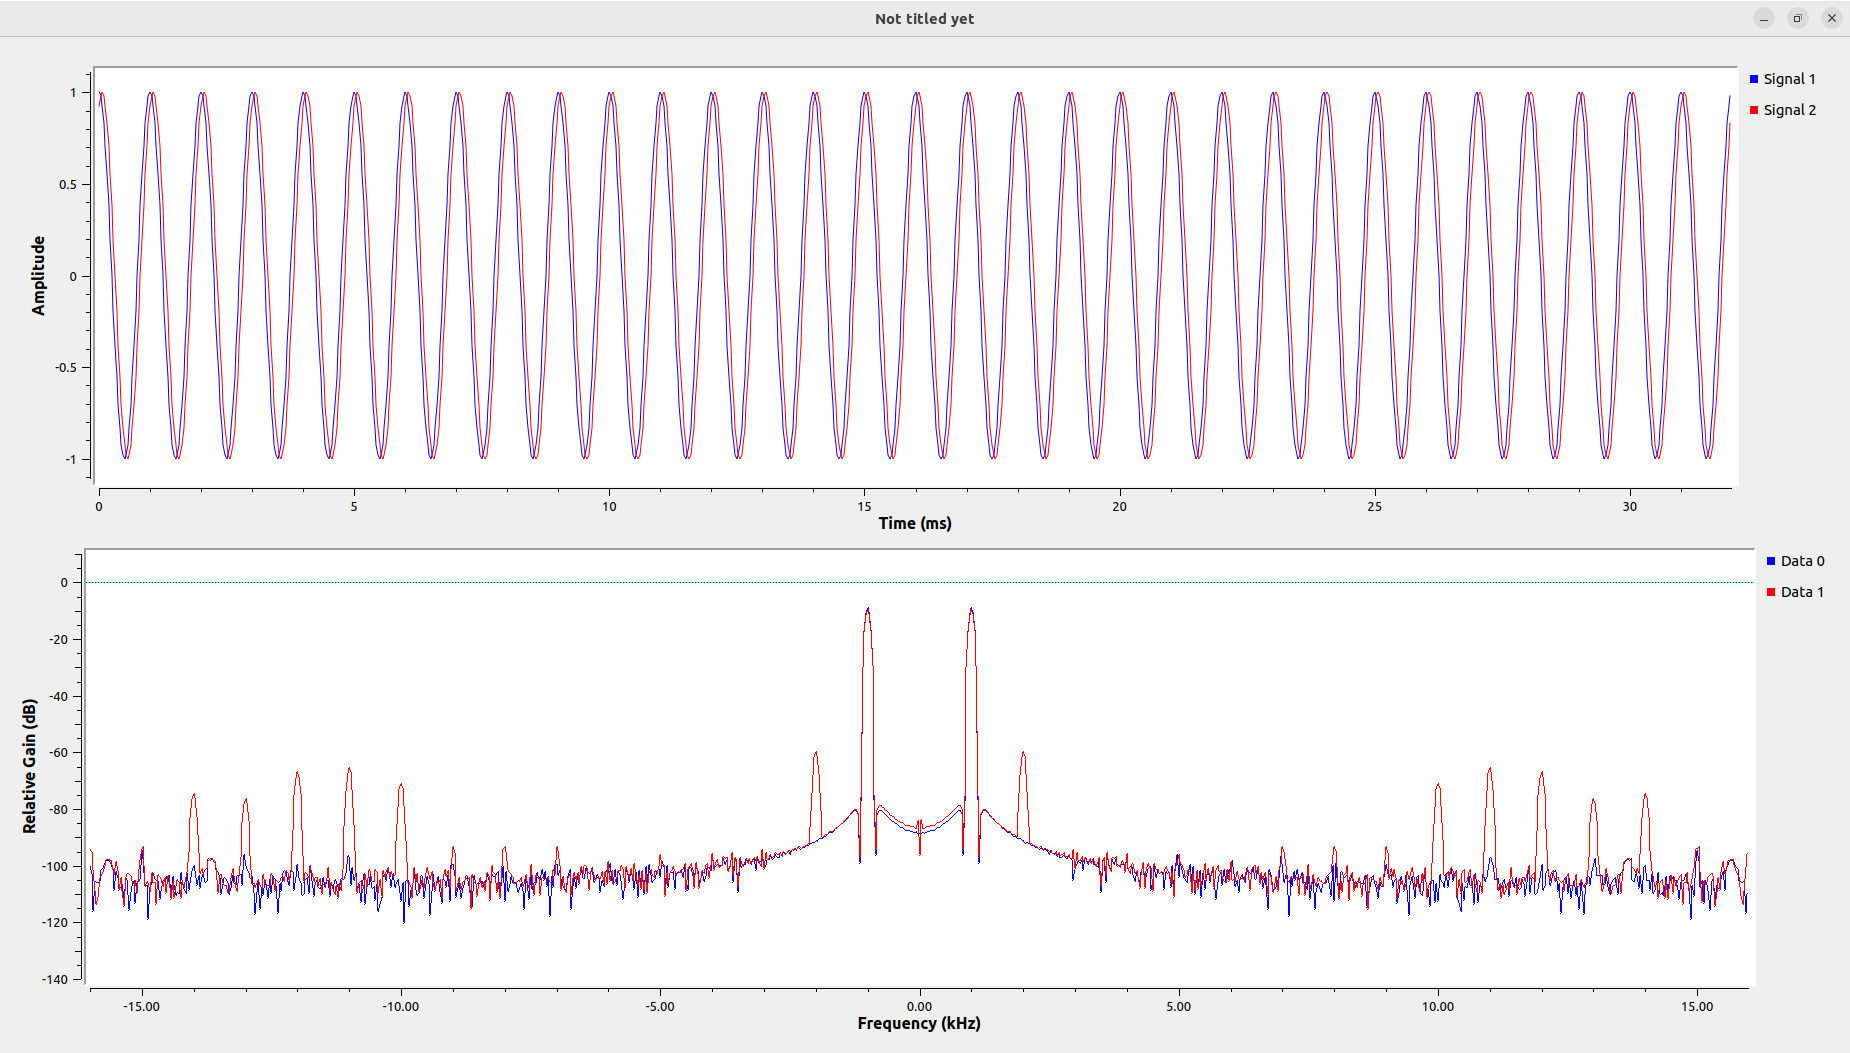
5.2.4. How do the original and received waveforms compare? (Discuss amplitude, frequency, phase, and spectral content).
As said just before, the signals are practically the same, but we notice a slight change in phase between the original signal and the demodulated signal. This may be due to the LPF that is not perfect. Related to frequency and amplitude both are the same. In the frequency domain both match but the demodulated signal contains floor noise and some unwanted frequencies between 10 and 15kHz.
5.3 AM Noise Performance
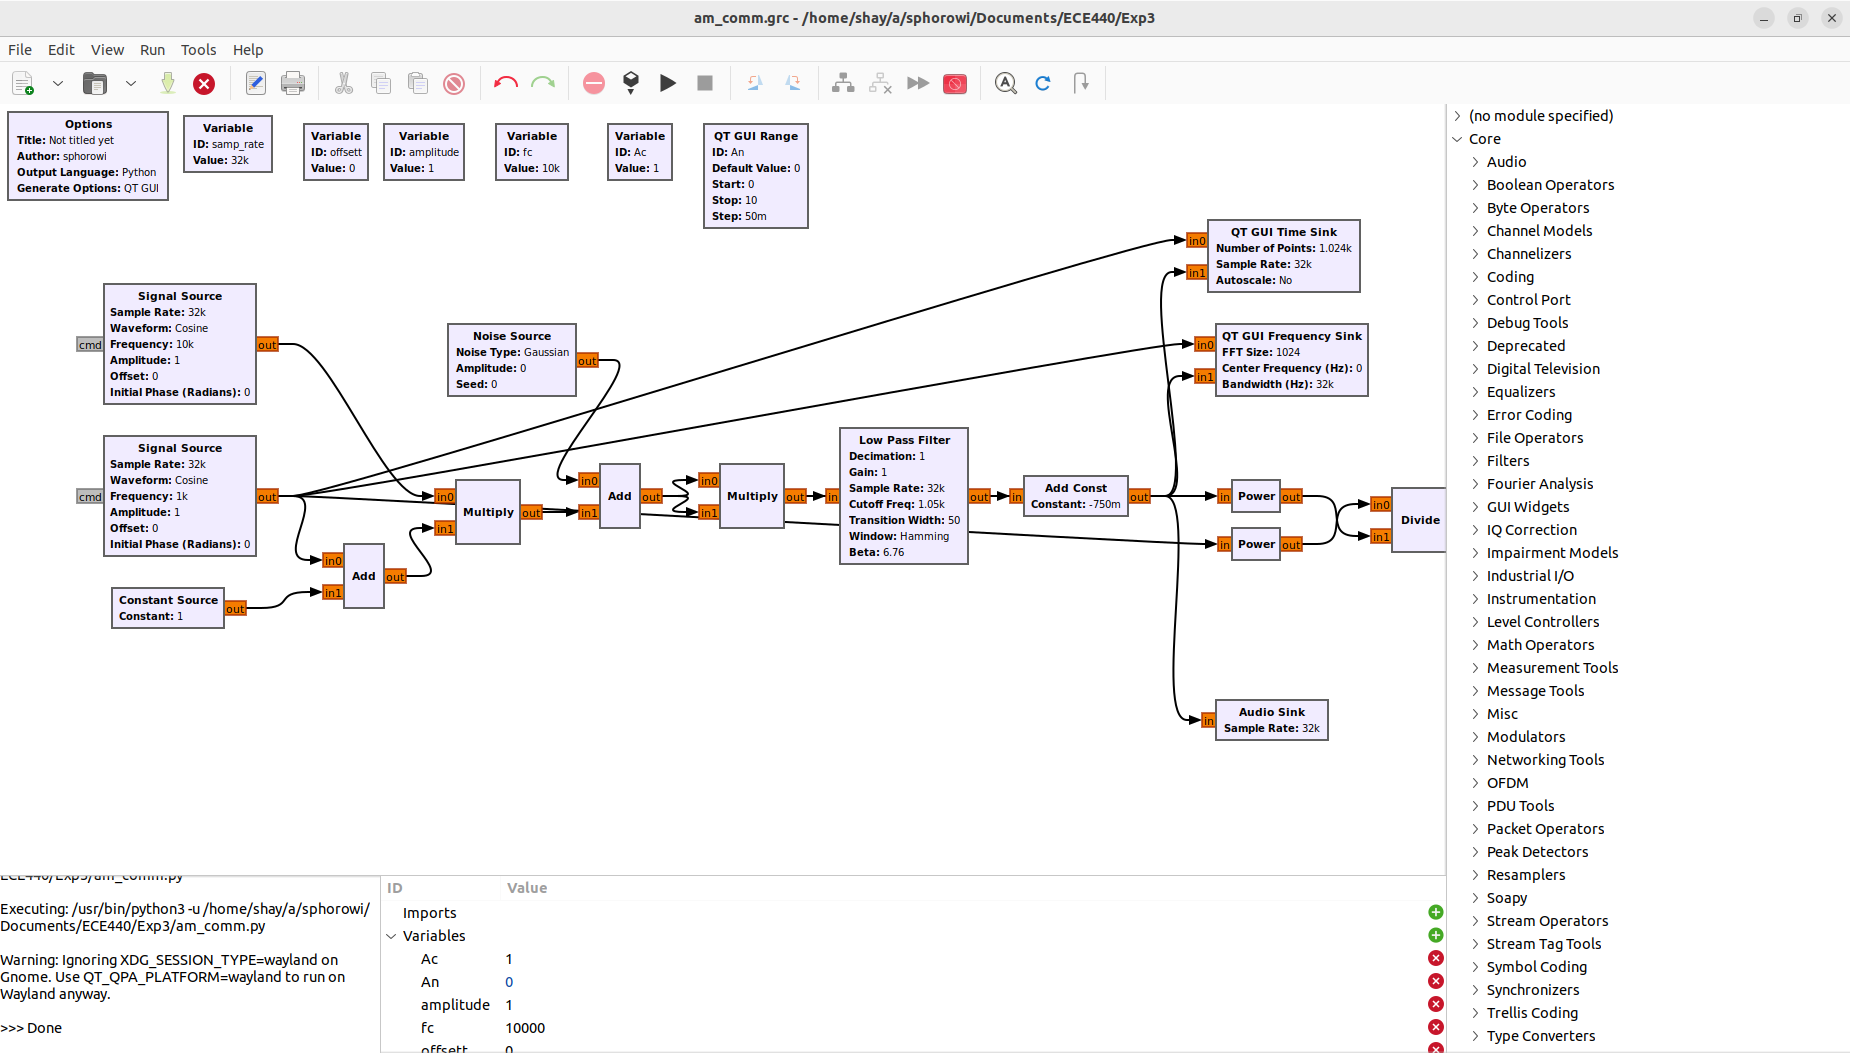
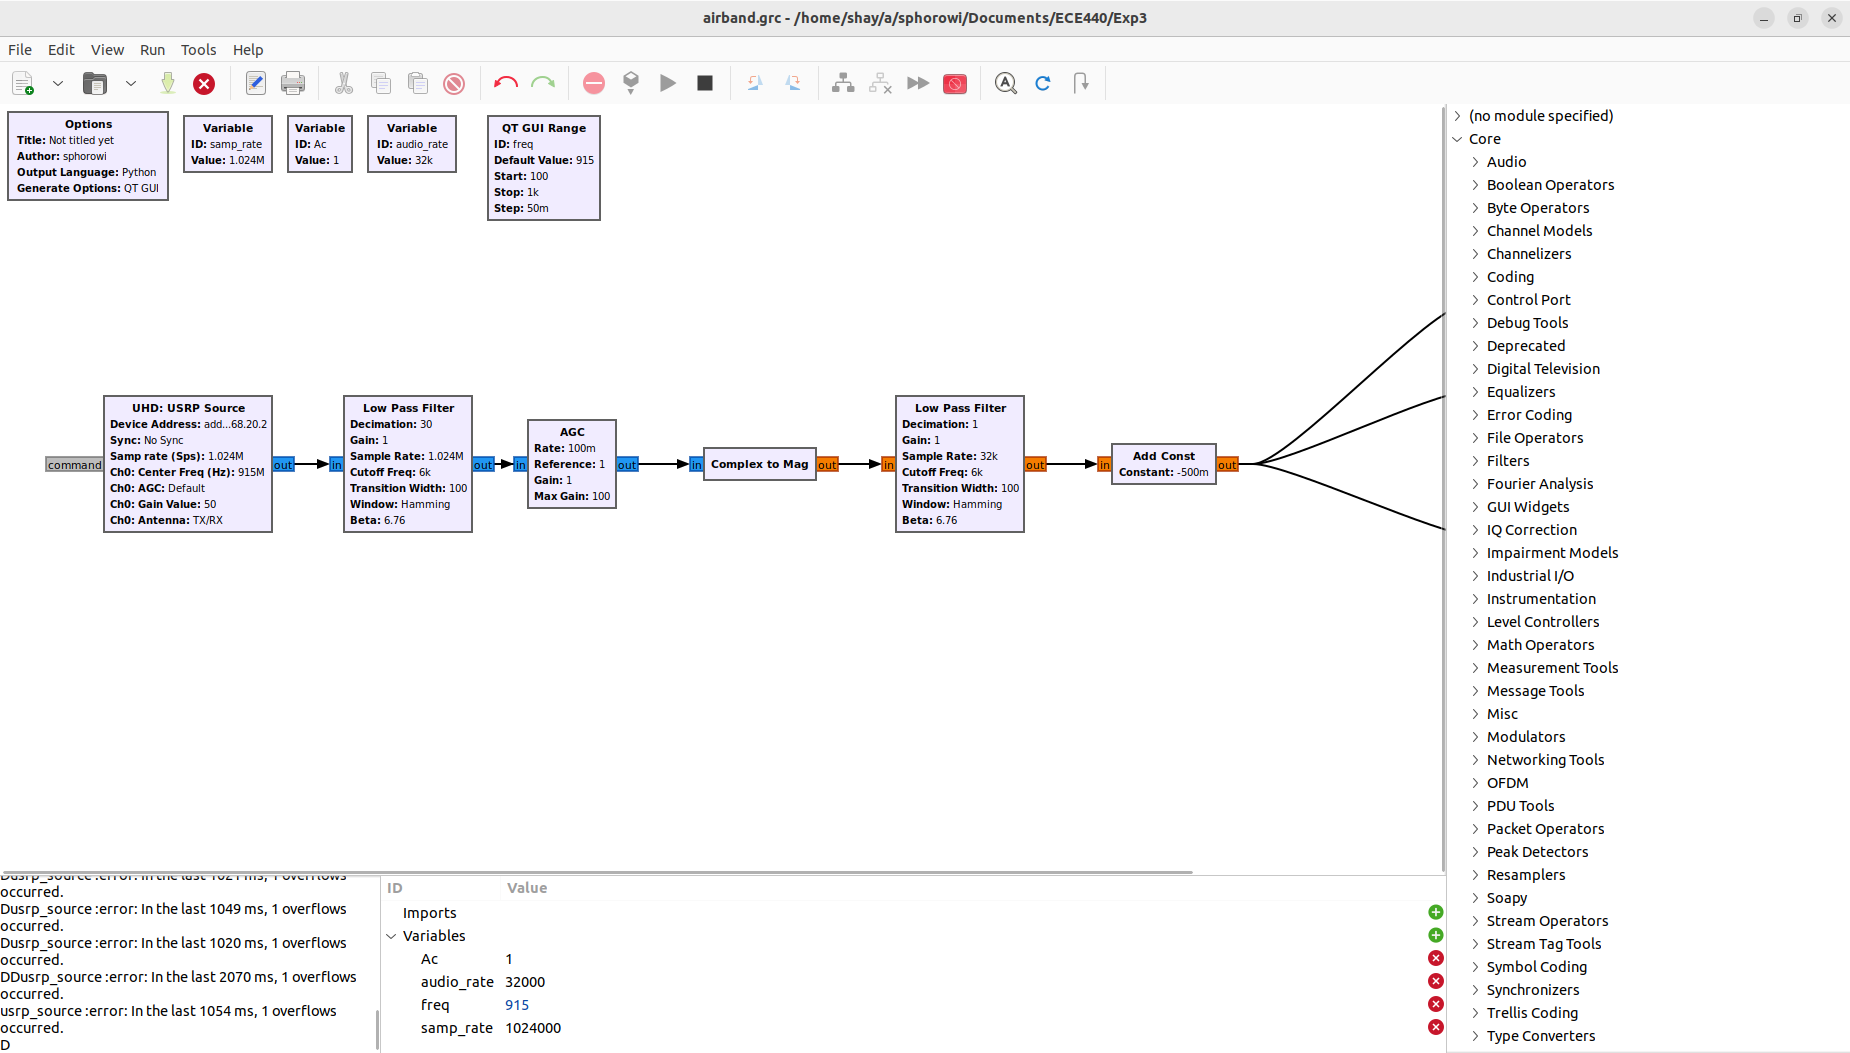
5.3.1. Provide a clean, organized screenshot of your flowgraph
5.3.2. Execute the flowgraph, and experiment with various noise amplitude levels. How sensitive is the AM communications system to introduced noise? At what noise level do you find the audio quality degraded beyond acceptable limits? What is the resulting SNR from this noise level?
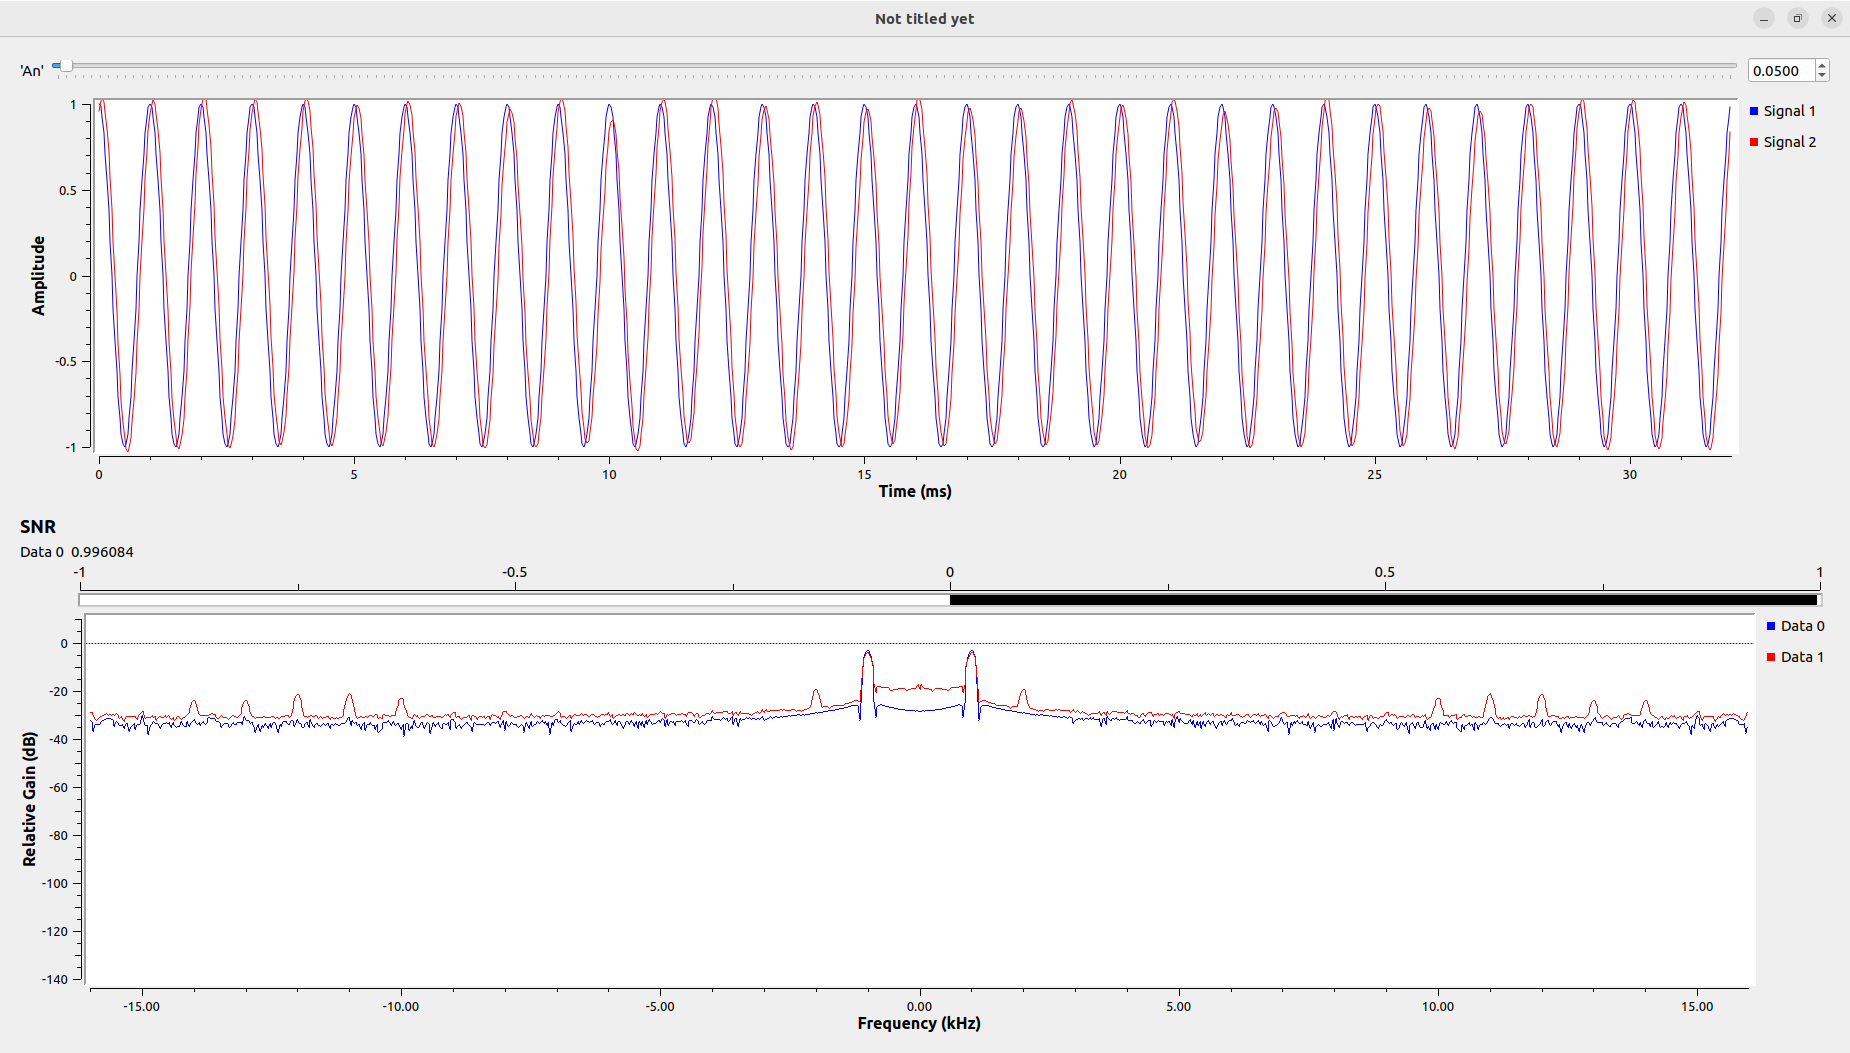
It is very sensitive to noise. We found an amplitude of 0.05 starting to cause the audio quality to degrade beyond acceptable audio limits.
5.3.3. Based on your answers to question 2, speculate why amplitude modulation might not be the modulation technique of choice for music broadcasting in the world today.
The SNR is pretty good, just 0.99. However, the audio quality is horrible. We can assume that one of the weaknesses of AM is that it is very sensitive to noise. I am sure that there are better techniques nowadays to avoid this bad quality audio and make it more efficient. Its easy implementation made it a good option for early 1900 but with today’s technology other options are better.
5.4 Airband Communications Reception
1. Provide a clean, organized screenshot of your flowgraph
2. Listen to various airport Airband stations. Of the stations listed in prelab exercise 5.6, which
ones were you able to receive signals on?
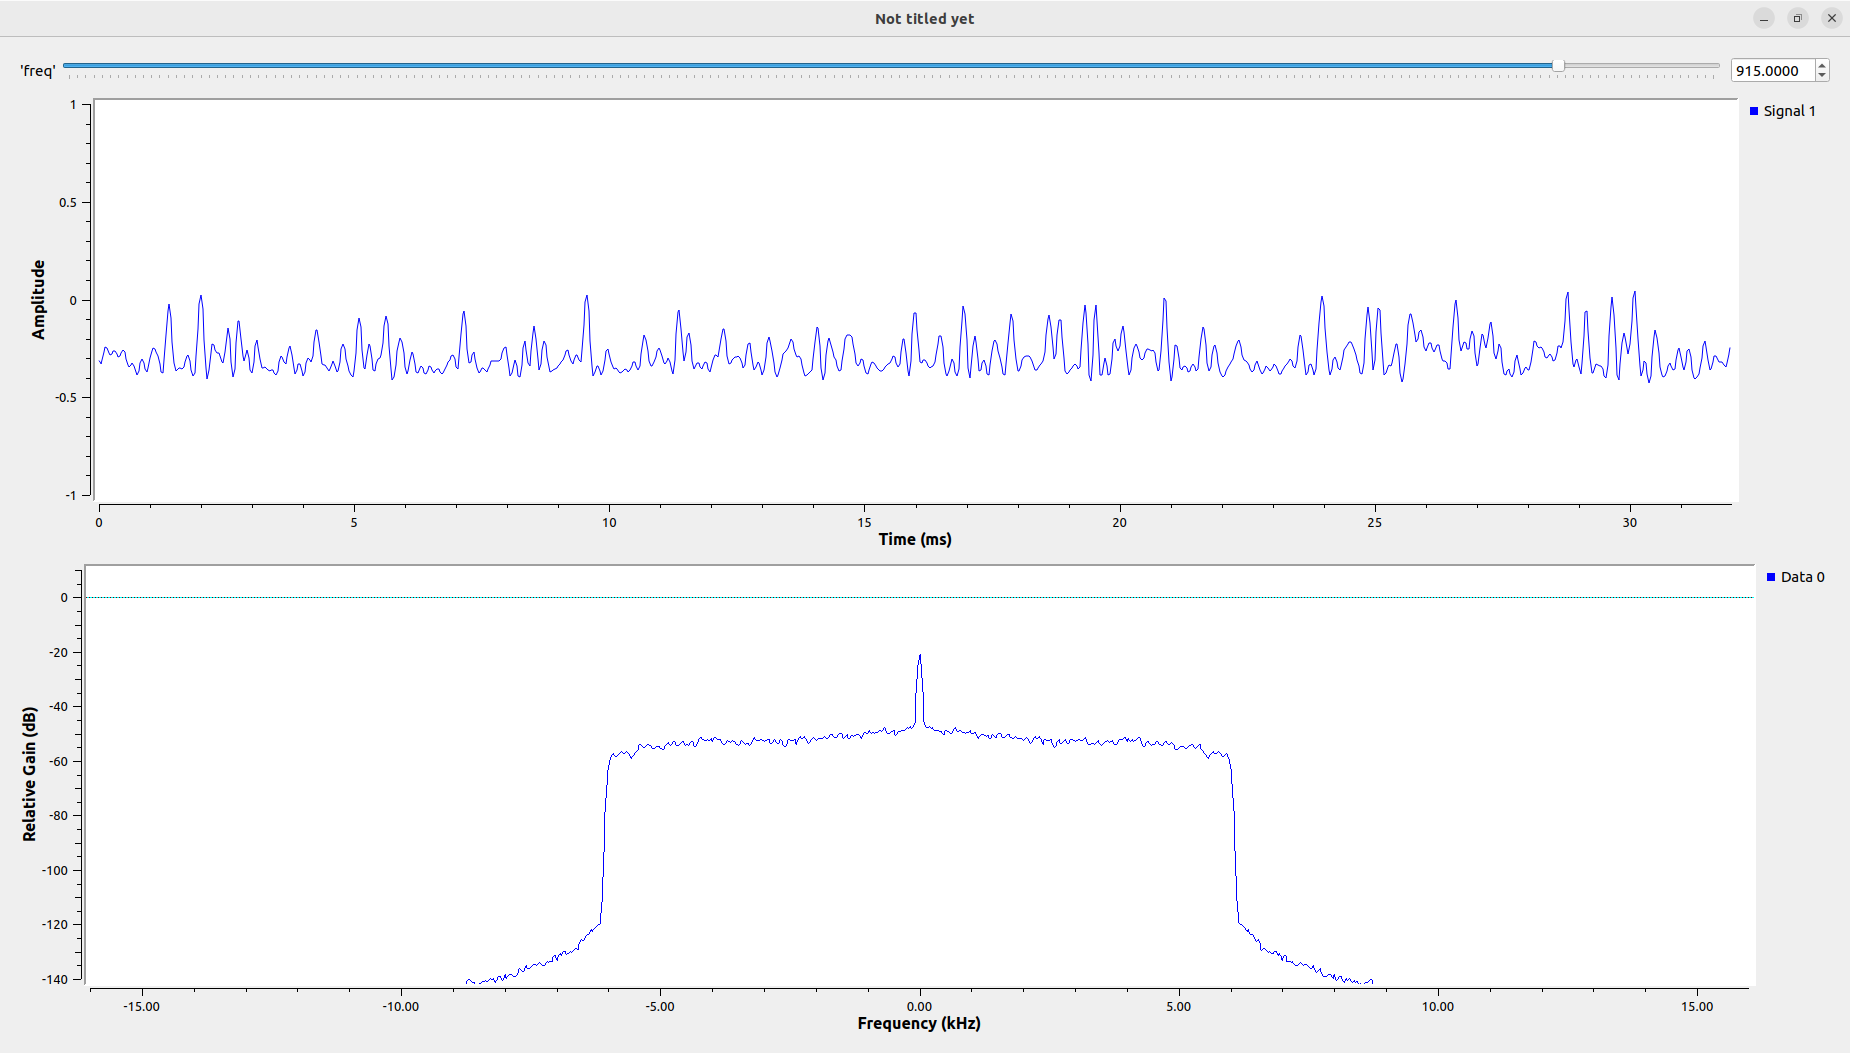
This graph represents one of the listened signals. Its quality was bad. Overall, no signal was good to understand something properly.
3. Provide a description of a transmission you were able to receive. (Note: it may be difficult to
hear and comprehend the transmission the first time it is sent live over the air. In this situation,
consider making a recording of the radio signal using a GRC Wav File Sink block.)
nothing intelligible